WPS Standard is our classic, industry-standard approach to whole plasmid sequencing, using Oxford Nanopore’s latest library preparation chemistry and R10.4.1 flow cell technology. This method enables direct sequencing of all DNA molecules present in your sample, without prior sequence knowledge.
WPS Standard not only delivers a highly accurate plasmid sequence, but also provides valuable insights into sample quality, including contamination, multimerization, and plasmid heterogeneity.
Our library preparation workflow begins with sequence-independent linearization of plasmid DNA. Barcodes are then attached to the linearized ends using Oxford Nanopore’s rapid-based chemistry, allowing multiple samples to be multiplexed and sequenced in a single run. Sequencing is performed on an Oxford Nanopore R10.4.1 flow cell.
After sequencing is complete, raw reads are basecalled using the latest Dorado Super Accuracy model. These high-accuracy reads are processed through our in-house analysis pipeline, where they are assembled into a high-confidence consensus sequence.
In parallel, additional analyses are performed on the raw data to assess key quality metrics, including:
· sequencing coverage
· E. coli genomic contamination
· plasmid multimerization (dimers, trimers, etc.)
Once processing is complete, all results are uploaded to our secure customer portal, and you will receive an email notification when your data is ready. Details of all deliverables are outlined below.
Sequence Files
· FASTA file
A text-based file containing the final consensus DNA sequence.
· GenBank file
Includes the consensus sequence along with annotated genetic features.
· AB1 file
A Sanger-style chromatogram view of the consensus sequence, allowing visualization of variants and low-confidence positions. Each peak color corresponds to a specific nucleotide.
Read-Level Data
· Per-base data file
Provides a detailed breakdown of how individual raw reads support each base in the consensus sequence. This file is used to generate the AB1 chromatogram.
· Alignment file
Displays the alignment of raw reads to the consensus sequence, enabling evaluation of sequencing data at a molecular level.
· FASTQ file
Contains all raw sequencing reads generated for your sample.
Report(s)
· QC report file
A comprehensive quality control report containing key metrics and visualizations, including:
1. Coverage plot
Shows read depth across the consensus sequence. Sudden changes in coverage may indicate mixed plasmid populations.
2. Read-length histogram
Displays the distribution of raw read lengths. A single dominant peak typically indicates a pure sample, while multiple peaks may suggest concatemers or additional DNA species.
3. Virtual gel
A simulated gel image generated from raw read data, providing an intuitive view of sample composition.
4. Multimer metric
Reports the percentage of plasmid concatemers (dimer, trimer, tetramer).
Learn more: https://blog.addgene.org/plasmids-101-dimers-and-multimers
5. E. coli genomic contamination metric
Indicates the proportion of reads derived from E. coli genomic DNA.
6. Additional sample metrics
Including total reads, total bases, reads mapped to consensus, sample name, consensus length, and related statistics.
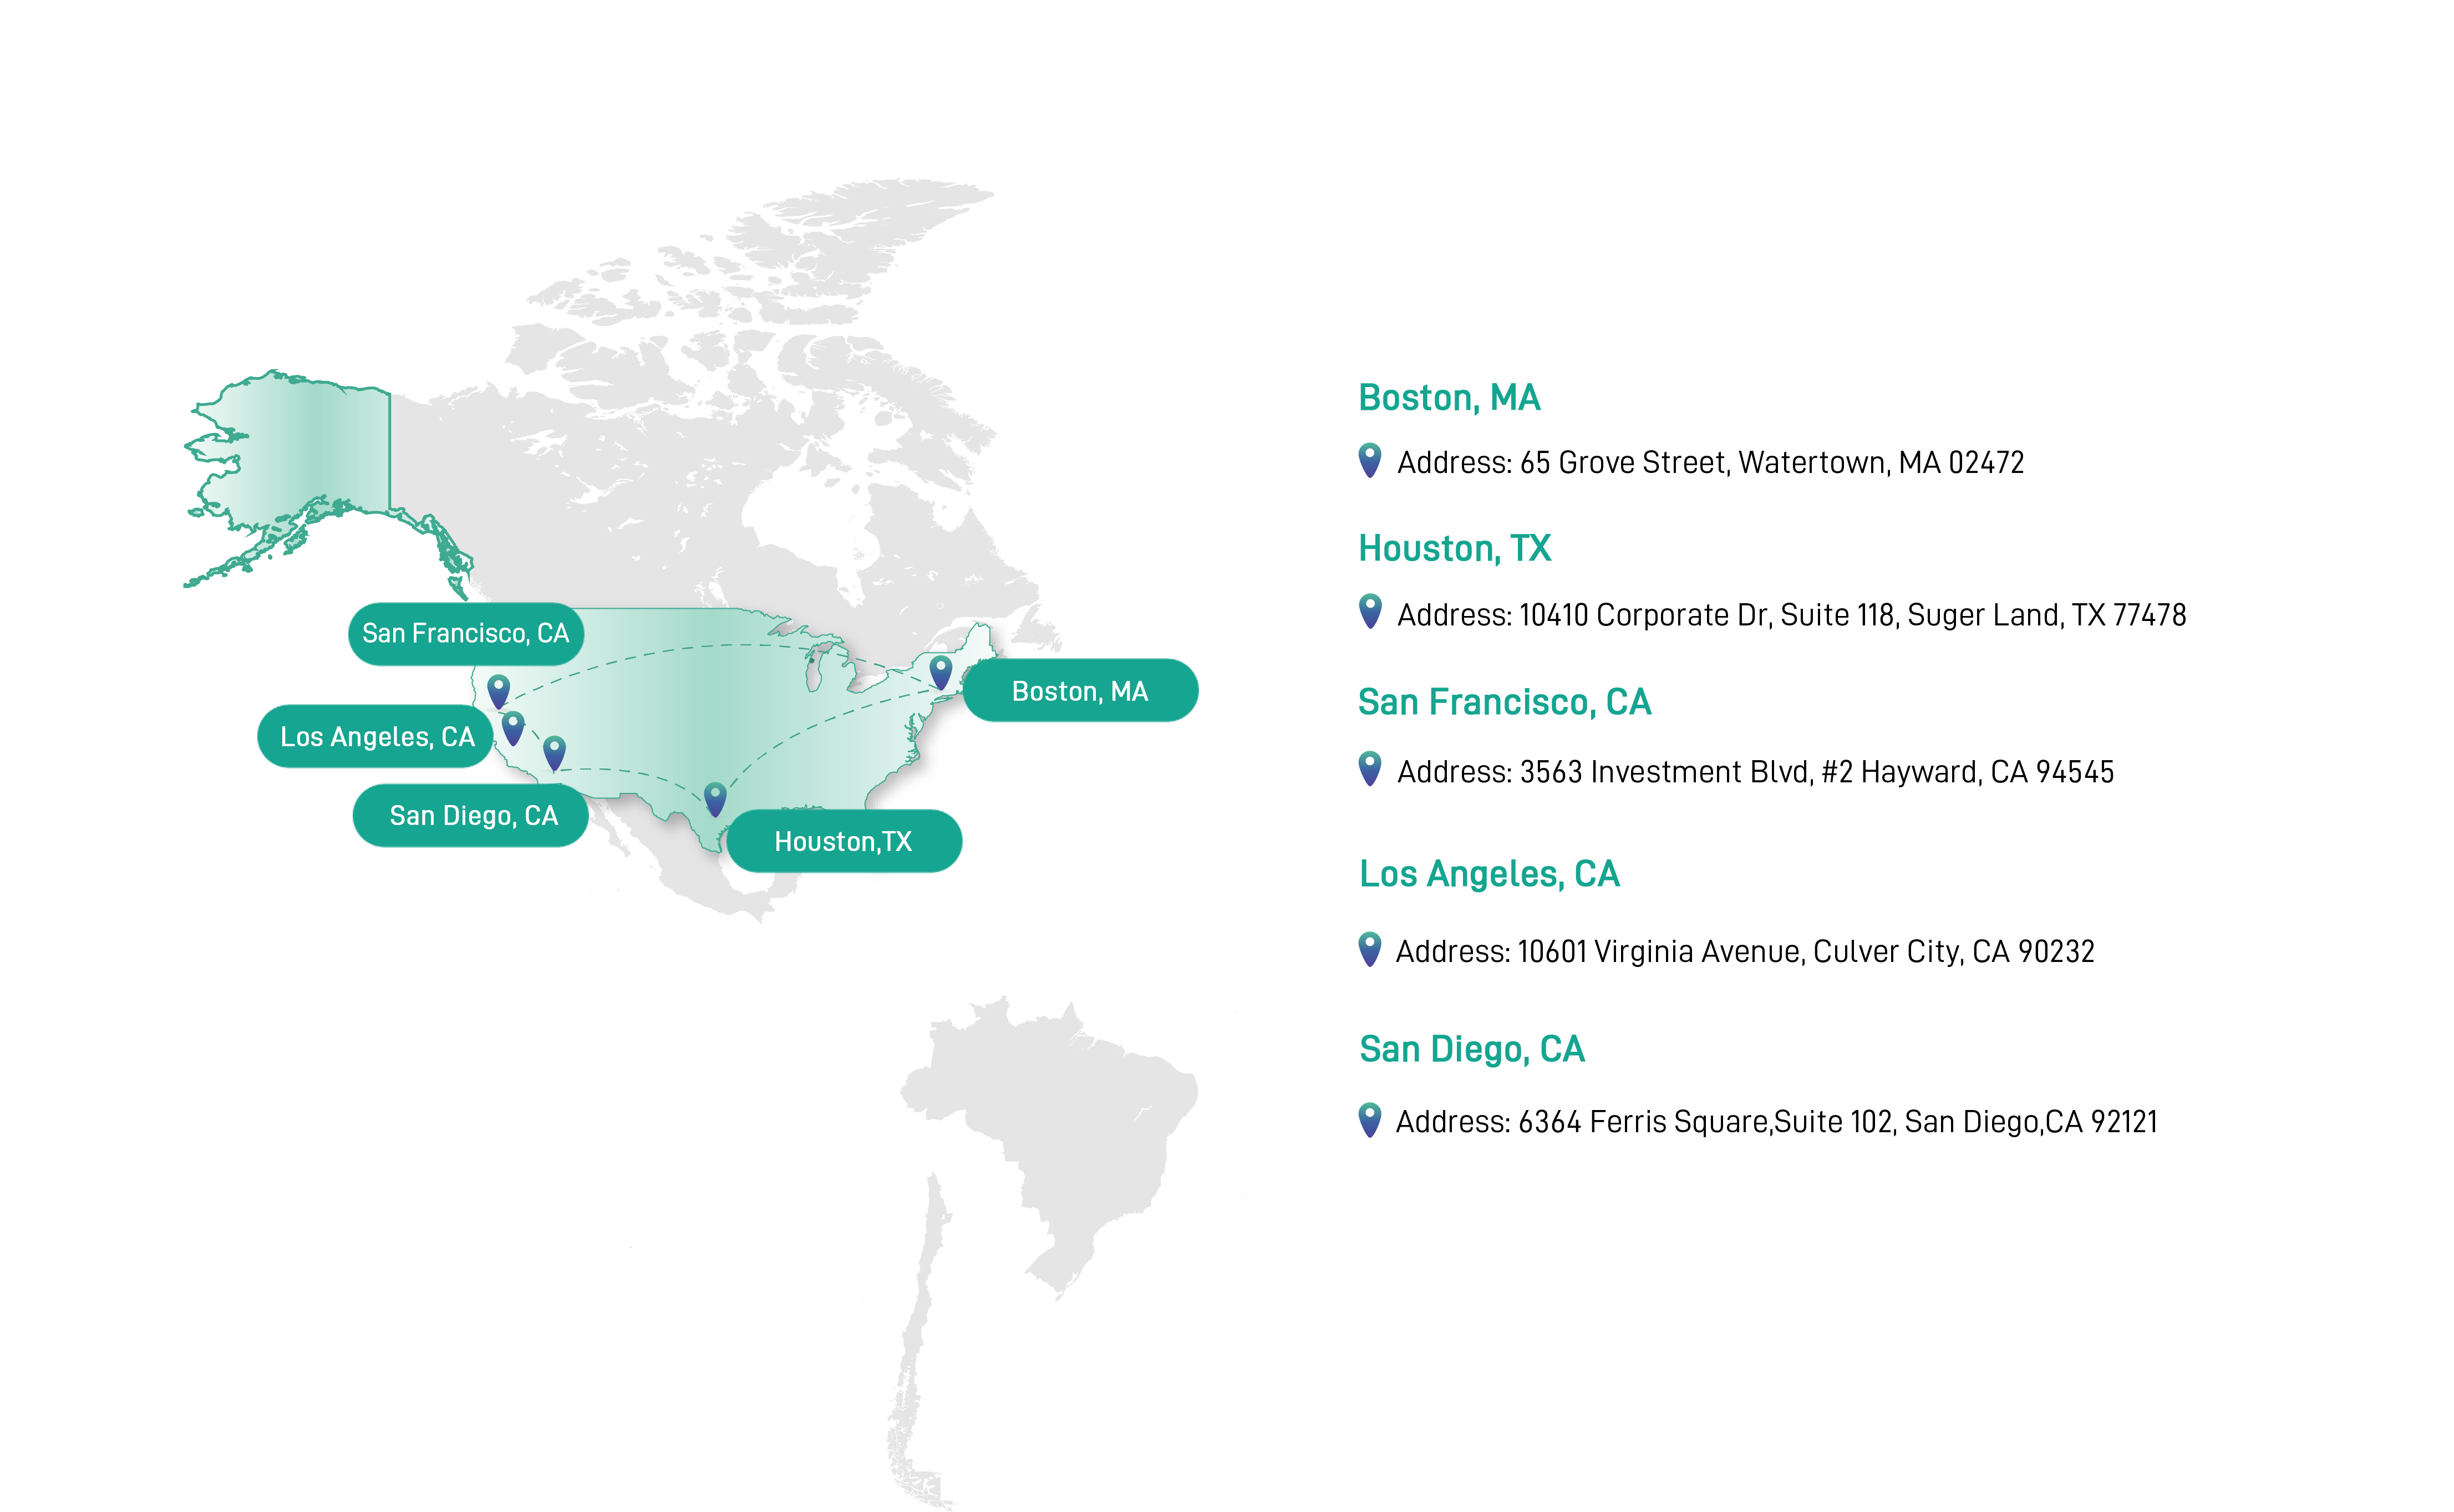
We Go Fast, You Go Forward
![]() sales.us@quintarabio.com
sales.us@quintarabio.com
Quintara Biosciences © 2025 All Rights Reserved | Site Map | Terms of Use | Privacy Policy